Three common data patterns
The best way to spot a pattern in your data is to graph it. Graphs can reveal trends in the data that you simply can't see by looking at a long column of numbers.Proportionality
Suppose you are trying to find the relationship between the volume of water and the mass of water experimentally. You weigh several different samples of water and determine their volumes as follows:| mass of water (g) |
volume of water (mL) |
| 238.3 | 239.0 |
| 499.8 | 501.3 |
| 846.3 | 848.8 |
| 1010.0 | 1013.0 |
What is the pattern in this data? Increasing the mass of the sample seems to increase the volume of the sample by roughly the same amount; doubling the mass doubles the volume. If you divide the volume by the mass for each of the four points, you get 1.003 mL/g every time. For this experiment, water has a constant volume per gram. To make the pattern plain, you can graph the volume as a function of mass:

Take a ruler and draw the best straight line through the data points. The slope (steepness) of the line is telling us how fast volume changes for a particular change in mass. The slope happens to be 1.003 mL/g. We can summarize ALL of the data using a simple equation:
where V is the volume of water in mL, m is the mass, and c is the proportionality constant; 1.003 mL/g in this case. We can say that volume of water is directly proportional to mass of water.
The direct proportionality relation between volume and mass is often written in physical sciences this way:
The symbol
![]() means "is directly proportional to" or "is equal to some constant times". This is a useful way to summarize the relationship between the two variables if we don't know (or don't care) what the actual value of the proportionality constant is.
Saying
V
means "is directly proportional to" or "is equal to some constant times". This is a useful way to summarize the relationship between the two variables if we don't know (or don't care) what the actual value of the proportionality constant is.
Saying
V ![]() m
is equivalent to saying any of the following:
m
is equivalent to saying any of the following:
V/m is a constant.
V = c m, where c is some constant.
V1/m1 = V2/m2 where 1 and 2 are any pair of data points.
This last statement allows you to predict the value of any one measurement given the other three.
Exercise 1. Using the symbols given, write the following relationships in as many ways as you can. Sketch a graph of the relationship. What is the slope of the line on the graph?
Exercise 2. Use the proportionality relationships from Exercise 1 to compute the following.
Linearity
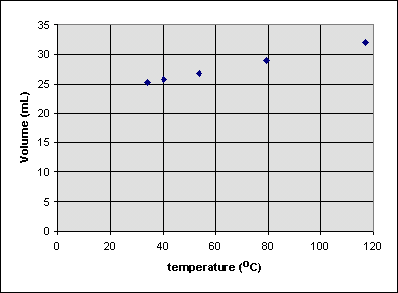
It's easy to see that if the mass of water was zero, the volume of water would also have to be zero. But consider the following experiment, in which the volume of a balloon is measured at several different temperatures:| volume of gas (mL) |
temperature of gas (°C) |
| 101 | 8.4 |
| 231 | 370.7 |
| 416 | 886.3 |
| 892 | 2213.0 |

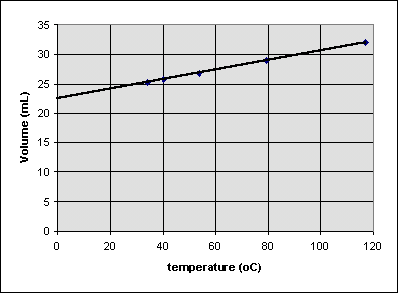
Is the volume of the balloon zero at 0°C? To see, we can extrapolate the best straight line that can be drawn through all of the data points to 0°C:

It seems that the volume of the balloon around 0°C will be around 22.5 mL. So it is incorrect to write
or
because the volume isn't zero when when the celsius temperature is zero. We can write
where b is the volume at the point where the extrapolated line hits the volume axis (about 22.4 mL in this case). b is sometimes called the y-intercept of the line.
As with proportionality relations, c is a constant that is just the slope of the line. It's possible to have negative slopes, which indicate that the variable on the y-axis decreases as the variable on the x-axis increases.
Inverse Proportionality
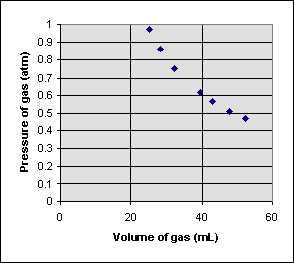
Sometimes one measurement decreases as the other increases in a simple but nonlinear way. Consider the following experiment, which measures the pressure of a gas trapped in a closed syringe as the plunger is pulled outward:
|

|
It looks like doubling the volume cuts the pressure to one half its original value. Multiplying the pressure and volume together for each point, we get the same number (22.46 mL atm) every time. The relationship between pressure P and volume V can be written
or
or
When two variables are related this way, they are said to be inversely proportional.
General Chemistry Online! Data patterns
Copyright © 1997-2005 by Fred Senese
Comments & questions to fsenese@frostburg.edu
Last Revised 02/23/18.URL: http://antoine.frostburg.edu/chem/senese/101/gases/print-patterns.shtml